Printable Graph Worksheets: Bar Graphs, Pictographs, Line Graphs and More in Minutes
Data handling is one of the most practical parts of school maths: students count, sort, draw and read graphs, and then use them to answer real questions. But good graph worksheets are slow to make. You need believable data, a scale that fits the paper, labels that line up, questions whose answers really come from the graph, and an answer key. This guide explains what makes a good graph worksheet, which graph to use at which level, and how the Graphs & Charts Studio in your OnlineMathWorksheet account builds printable bar graphs, pictographs, line graphs, pie graphs, box plots and coordinate grids — with questions and answer pages — in a few minutes.
- Three kinds of graph worksheet
- 21 graph types for every level
- Picture graphs with a key
- Data that makes sense, or your own
- Easy, medium or hard
- Questions you can edit — and a bank of suggestions
- Statistics and coordinates for older students
- A page that looks like your own
- Up to 50 pages with one click
- Classroom tips
Three kinds of graph worksheet
Every graph in the studio can be printed in three ways, so the same topic covers a whole sequence of lessons:
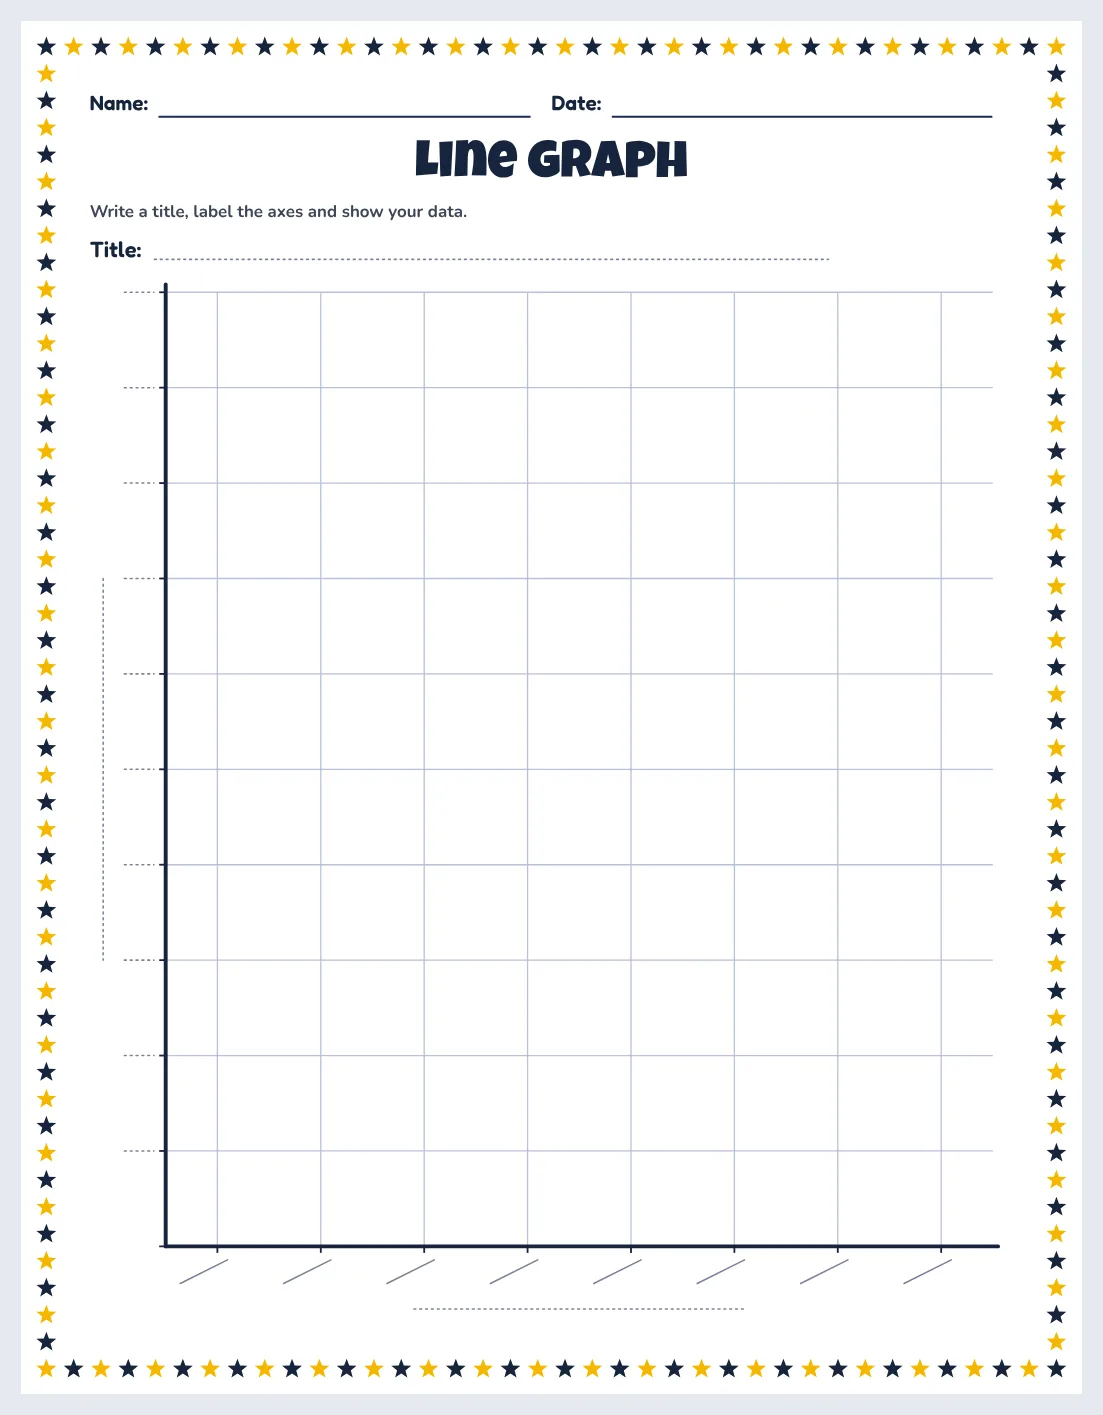
- Blank template — an empty graph like printed graph paper, with lines for the title, the labels and the key. Students collect their own data (a class survey, the weather this week) and show it.
- Make the graph — students get the data as a table or as a list of items to count, and draw the graph themselves. The answer page shows the finished graph.
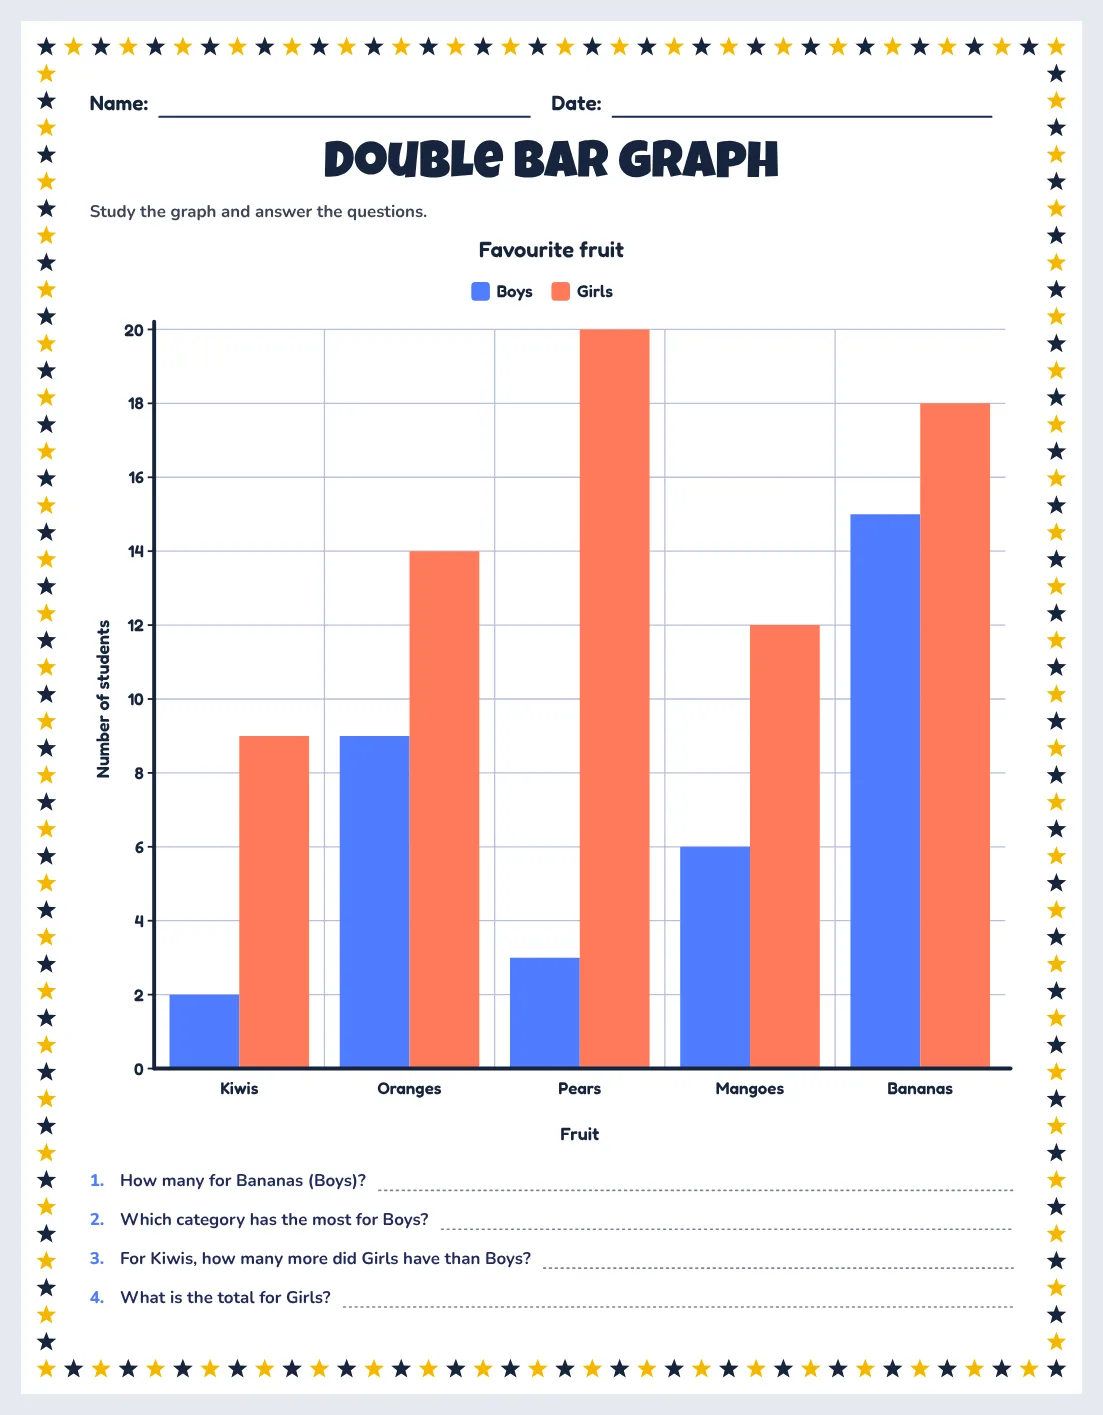
- Read the graph — the graph is already drawn, and students answer questions about it: the most and the least, differences, totals, fractions and percentages.
Moving from reading to making to collecting is the natural order for young learners, and you can mix all three in one booklet.
21 graph types for every level
| Bar graphs | Vertical bar graph, horizontal bar graph, double bar graph and grouped bar graph. |
|---|---|
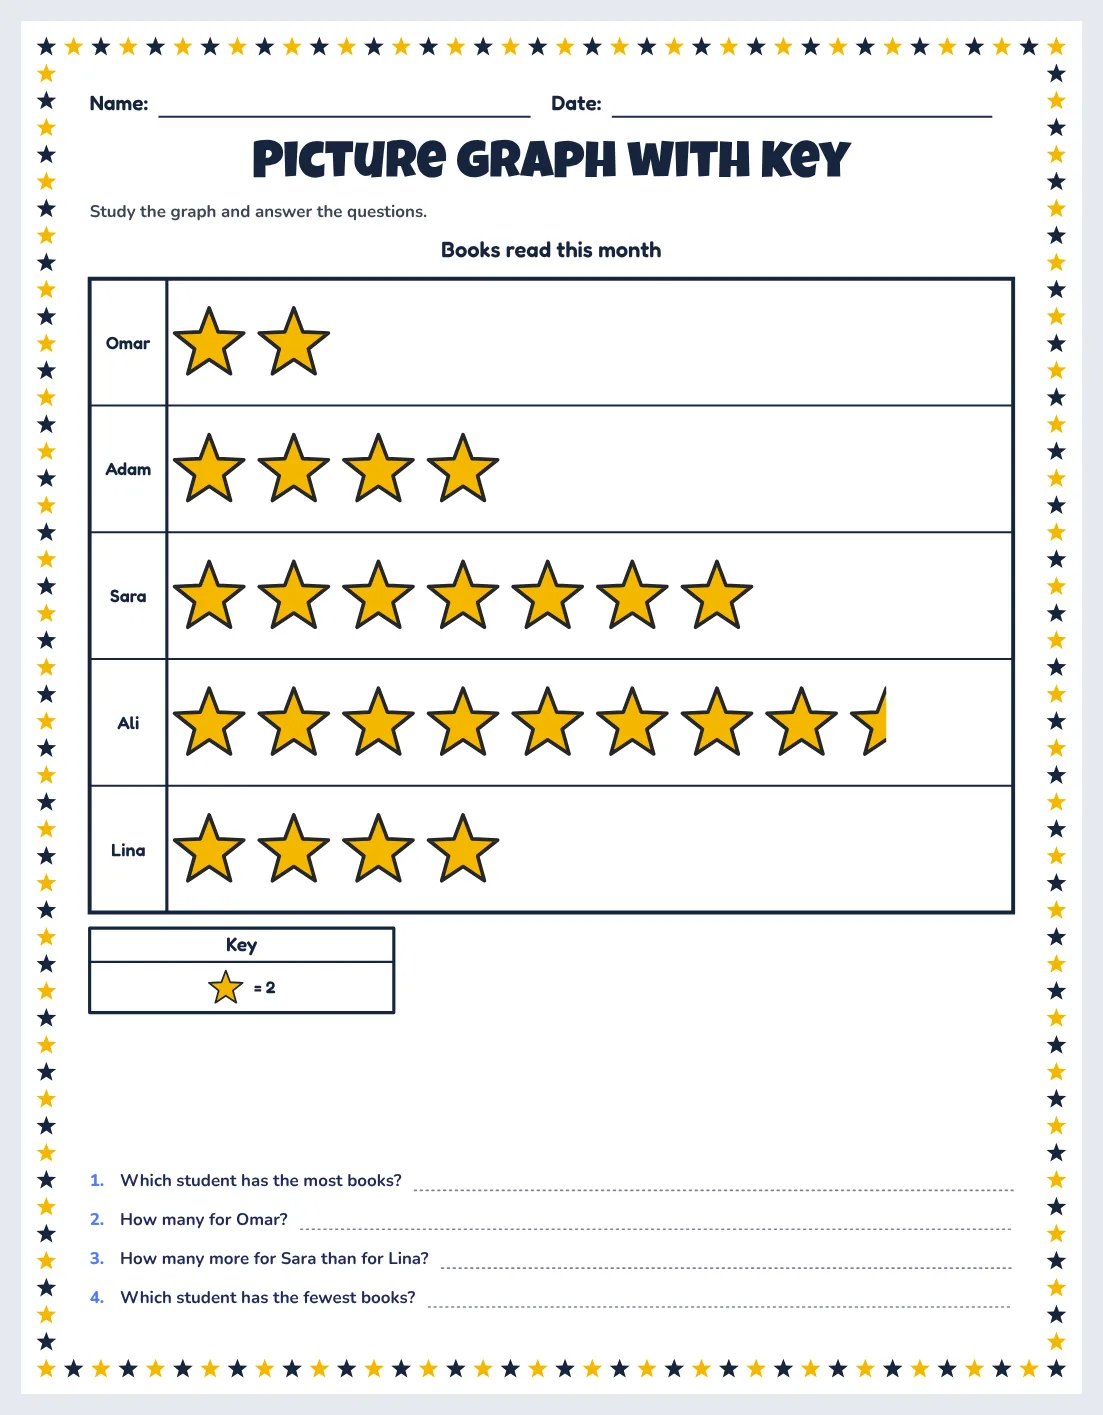
| Picture graphs | Pictograph, picture graph with key (with half pictures), double pictograph and comparison picture graph. |
| Tables | Tally chart with real bundles of five, and frequency table. |
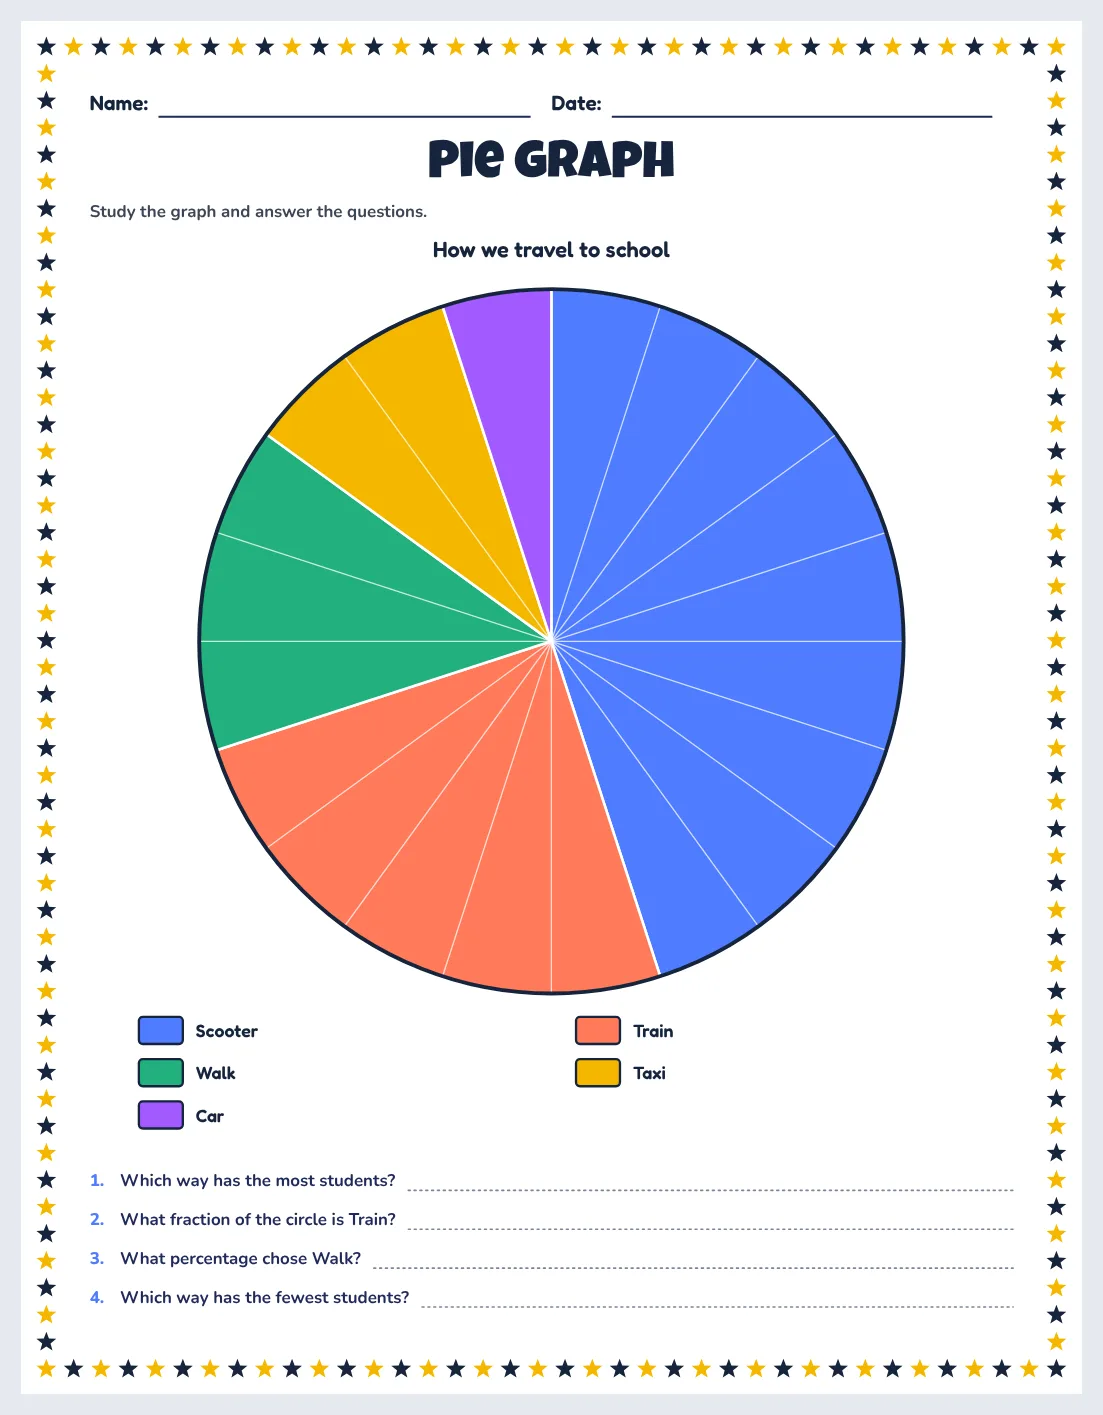
| Lines & circles | Line graph, time-series graph (days, months, hours) and pie graph (circle graph). |
| Statistics | Cumulative frequency graph and box-and-whisker plot with the five-number summary. |
| Coordinates | First-quadrant grid, four-quadrant coordinate plane, XY graph of a line y = ax + b, and plot-and-connect mystery pictures. |
| Number charts | Array chart for multiplication and hundred chart. |
Tally charts and pictographs suit kindergarten to grade 2, bar and line graphs grades 2 to 5, and pie graphs, coordinates, cumulative frequency and box plots grades 5 to 9.
Picture graphs with a key
Pictographs are often the first graph children meet. In the studio you choose the picture (star, heart, smiley, apple, ball, book, sun, flower, car and more) and what each picture stands for: 1, 2, 5 or 10. With a key of 2 or 10, some rows end with a half picture, which is exactly the skill students need to practise. The double pictograph compares two groups — boys and girls, Class A and Class B — with two colours and a two-line key.
Data that makes sense, or your own
Generated data comes from eight everyday themes: favourite fruit, pets, sports, colours and ice cream, how we travel to school, books read this month and the weather. Line graphs use growing plants and puppies, time series use temperatures, rainfall and library visitors, and the statistics graphs use test scores, heights and race times. The numbers are chosen so that questions have one clear answer — there is always a single largest and a single smallest category.
Prefer real data from your own class? Switch to My own data and type one line per category, for example Apples, 8. For double and grouped graphs add more numbers on the line, and for coordinate grids type points such as A, 3, 5.
Easy, medium or hard
- Easy: small numbers, a scale counting in ones, pictures that stand for 1 or 2, and five points on a coordinate grid.
- Medium: values up to 20 with a scale in twos, half pictures, longer time series and more points.
- Hard: values in fives up to 100, scales in tens, keys of 5 or 10, four-quadrant points, fractional answers and box plots with 15 values.
The number of categories, the grid size, the gridlines (full, across, up or none) and the line style — solid, dashed or dotted — are all yours to set.
Questions you can edit — and a bank of suggestions
Each read-the-graph or make-the-graph page gets automatic questions built from its own data, and the answers appear in green on the answer page. In the Questions panel you can rewrite any question and its answer, delete one, write your own, or pick from a list of suggested questions for that graph: which has the most or the fewest, how many more, the total, two categories together, the difference between the greatest and the least, putting the categories in order, a fraction or percentage of the circle, the median and range of a box plot, or y for a given x on a line graph. One click copies your list to every page.
Statistics and coordinates for older students
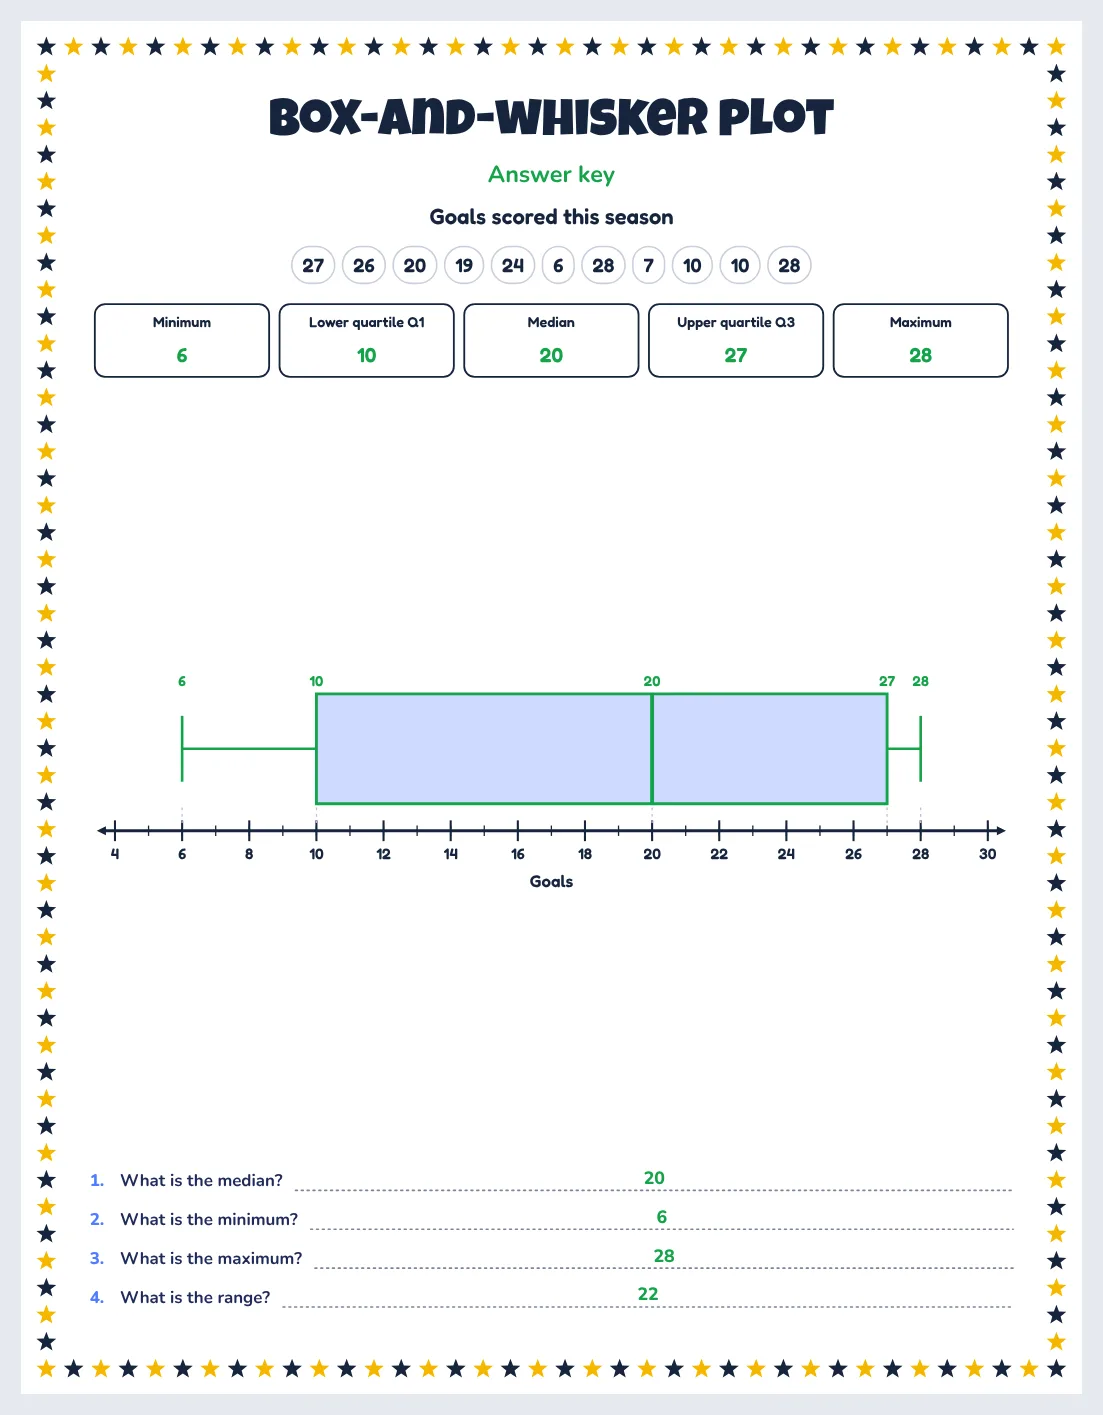
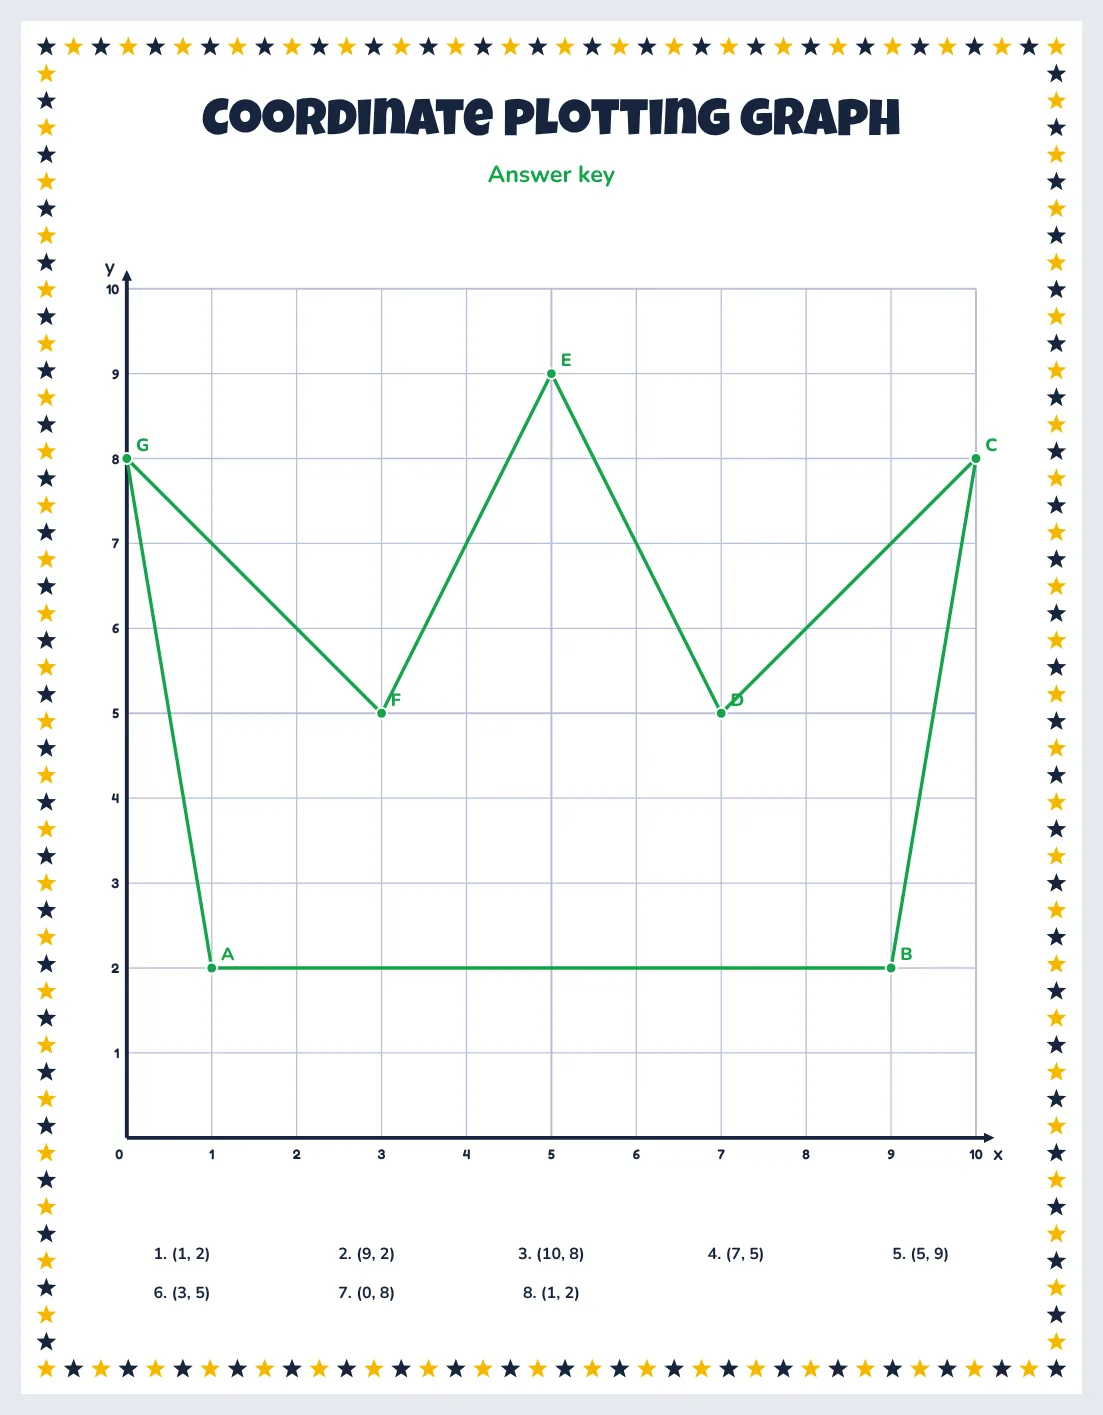
For grades 6 to 9 the box-and-whisker plot gives students the data, five boxes for the minimum, quartiles, median and maximum, and a number line to draw on; the answer page shows the finished plot. The cumulative frequency graph comes with a table to complete and a grid for the curve. On coordinate grids students plot or read labelled points, complete a table of values for y = ax + b and draw the line, or plot points in order and join them to reveal a house, a star, a fish, a rocket or a crown.
A page that looks like your own
- Main title — follows the graph type automatically, or type your own; choose its font, size and colour.
- Subtitle, name, date and class lines — each optional, each with its own font, size and colour.
- Graph style — label font and size, colourful, one-colour or ink-saver mode, axis and grid colours and thickness.
- Page border — a border of stars in two colours, or single or double lines, solid, dashed or dotted.
- Layout — page size, margins, and a graph that fills the page or stays compact.
Up to 50 pages with one click
✨ One-click set builds up to 50 pages: only the current graph type, all 21 types mixed, bar and picture graphs, tables and statistics, or coordinates. Choose read, make, or alternating pages, and let the difficulty rise from easy to hard through the set. 🎲 New data refreshes a page while keeping your design, so each group can get its own version.
Classroom tips
- Survey first: run a quick class vote, then hand out a blank template to graph the results.
- Read before you draw: start a unit with read-the-graph pages, then move to make-the-graph pages with the same type.
- Compare graphs: show the same data as a bar graph, a pictograph and a pie graph and ask which is easiest to read.
- Talk about scale: use the medium level, where values fall between gridlines, to discuss estimating.
- Self-check: give students the answer page after they finish, so they can compare their graph with the finished one.
Make your own printable activities in minutes
Answer keys · US Letter, A4 & KDP sizes · PDF, PNG, SVG, PPTX
Start your free day →Frequently asked questions
Which graph types can I make?
Twenty-one: vertical, horizontal, double and grouped bar graphs; pictograph, picture graph with key, double and comparison pictographs; tally chart and frequency table; line, time-series and pie graphs; cumulative frequency and box plots; first-quadrant, four-quadrant, XY and plot-and-connect coordinate grids; array chart and hundred chart.
Can I print blank graph templates?
Yes. Choose “Blank template” and you get an empty graph with lines for the title, the labels and the key.
Can I use my own class data?
Yes. Switch the data to “My own data” and type one line per category, such as Apples, 8.
Can I change the questions?
Yes. You can edit, delete and add questions, choose from suggested questions built from the data, and copy your list to all pages.
Is there an answer key?
Yes. Every make-the-graph and read-the-graph page gets an answer page with the finished graph and the answers in green.
How many pages can I make at once?
Up to 50 pages in one job. Answer pages are added at the end and are not counted.
Summary
Good graph worksheets need sensible data, a clear scale, questions that really come from the graph and an answer key. The Graphs & Charts Studio gives you 21 graph types, three worksheet styles, editable and suggested questions, your own data or ready-made themes, and up to 50 printable pages with answer pages.
More puzzle guides for teachers
We build math worksheets, puzzle makers, answer keys and classroom tools for teachers, tutors and homeschool parents, and keep these guides up to date.