Bar Graph Worksheets

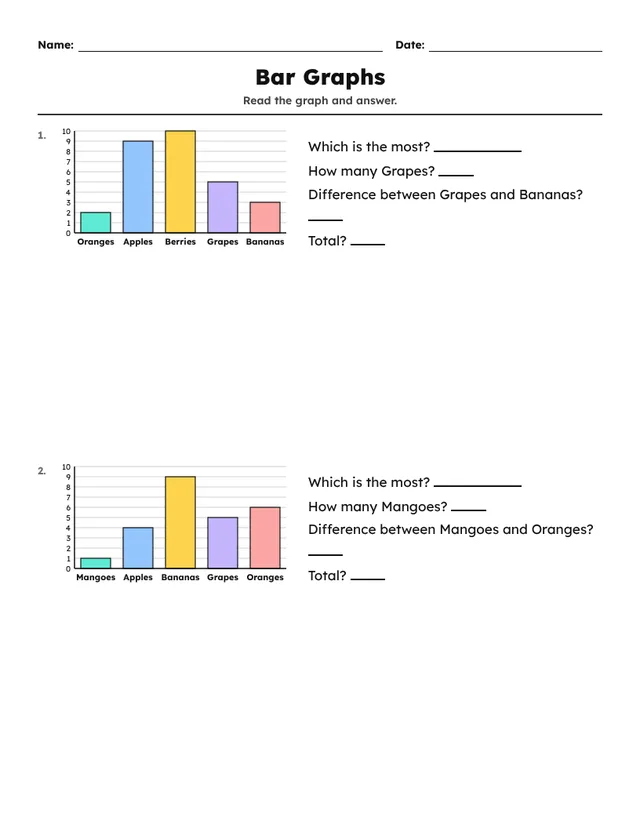
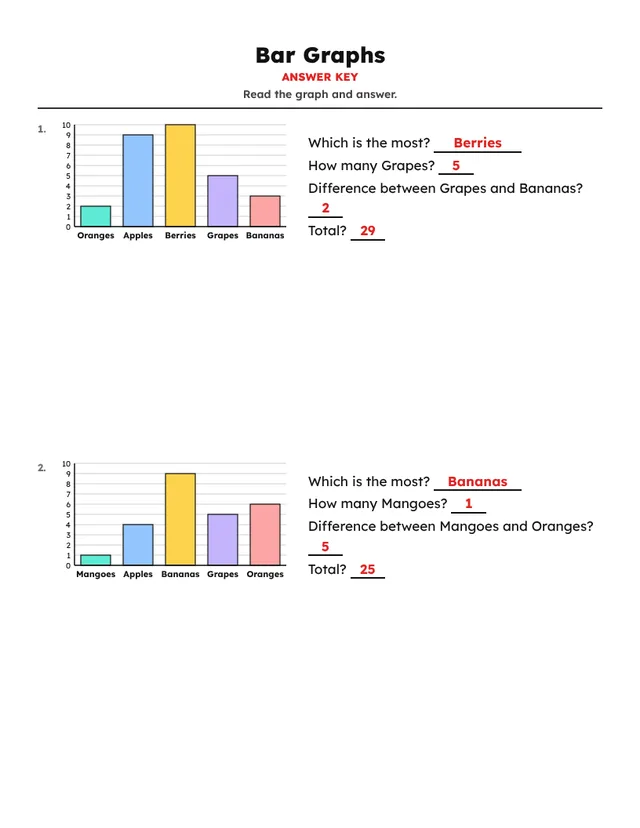
Reading graphs is a life skill. Each problem shows a colorful bar graph with questions like “which is the most?” and “how many more?”.
📥 Download the free bar graphs worksheet (PDF) — or read on to learn how to make your own versions in seconds.
What students practice
Example worksheet and answer key
Here is a bar graphs worksheet made with the default settings, next to the answer key that the tool creates automatically.
How to create a bar graphs worksheet in 60 seconds
- Sign in to OnlineMathWorksheet (or start the free 1-day trial) and open the tool.
- In Settings → Worksheet type, choose Bar Graphs from the Data & Statistics group.
- Open Problem options and adjust: Max value.
- Under Problem layout, pick the number of rows and columns (the default is 2 × 1).
- In Header, keep the title “Bar Graphs” and the instruction “Read the graph and answer.”, or write your own.
- Click New problems for this page until you like the set — every click creates a fresh version.
- Use Export to download a PDF with the answer key, or save the pages as PNG or JPG images.
Ready-made settings
Use these as starting points and adjust them to your class:
| Small values | Max value 10. |
|---|---|
| Larger values | Max value 20. |
Teaching tips
- Ask students to read the title and labels first.
- Have students create their own graph from a class survey.
- Connect to Coordinate Grid work.
Make your first bar graphs worksheet now
Try all 52 activities free for one day. No card needed.
Start free →Frequently asked questions
Do the bar graphs worksheets come with an answer key?
Yes. Every worksheet gets a matching answer page automatically. You can include it in the PDF or hide it.
Can I make a different version for each student?
Yes. Click “New problems for this page” to generate new numbers with the same settings — as many times as you like.
Which languages are available?
The worksheet itself can be printed in English, French, Spanish or Arabic, which is handy for bilingual classes.


